NOTE: Since virt-top 1.0.7 and libvirt 0.9.11 (with
virDomainGetCPUStats support) virt-top is able to
report true physical CPU stats, and this section no longer applies.
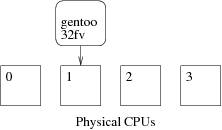
Shown below is a typical physical CPU screen with 1 host and 3 domains. As you can see from the left hand column, there are 4 physical CPUs in this system:
PHYCPU %CPU Domain-0 debian32fv f764pv gentoo32fv
   0    6.2  0.0=     0.1=       0.1=   5.9=
   1    6.2  0.0=     0.1=       0.1=   5.9=#
   2    6.2  0.0=#    0.1=#      0.1=   5.9=
   3    6.2  0.0=     0.1=       0.1=#  5.9=
If we take the gentoo32fv domain as an example, this domain happens to be assigned a single virtual CPU. Which physical CPU can this virtual CPU run on? You can pin virtual CPUs to physical CPUs, but in this case I didn't do any pinning, so gentoo32fv is free to run on any of the four physical CPUs.
But which physical CPU did it actually run on in the last 3 seconds (since the last screen update)?
Xen and other hypervisors try to keep domains running on the same physical CPU, because there is a significant cost to moving them around. However there is no particular guarantee that Xen won't move them around (unless you pin virtual CPUs to physical CPUs, which I'll talk about in a moment).
Unfortunately at this point we hit a limitation in Xen & libvirt.
PHYCPU ... gentoo32fv
   0        5.9=
   1        5.9=#
   2        5.9=
   3        5.9=
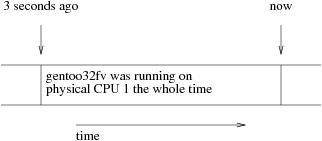
Xen through libvirt only tells us which physical CPU a domain is running on at this particular moment. In the display (right), the # tells us that gentoo32fv was running on physical CPU 1 at the moment that the screen was updated.
But in the last 3 seconds (since the last update) we don't know where the domain was running. It could have been this:
But also it might have been this:
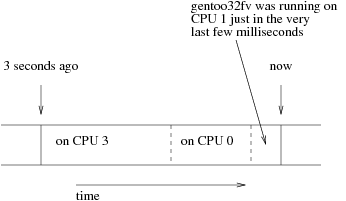
PHYCPU ... gentoo32fv
   0        5.9=
   1        5.9=#
   2        5.9=
   3        5.9=
Unless a domain is pinned, we have no way to know. What we do instead is to divide the time equally between all the possible physical CPUs that the domain might have run on, and mark that we have done this with =.
Possible workarounds are:
Longer term, this requires a fix in Xen and/or libvirt.
You will often see disk / network stats like RXBY and WRRQ show up empty, as in this example:
   ID S RDRQ WRRQ RXBY TXBY %CPU %MEM    TIME   NAME
    0 R                      2.1 66.0  30:50.81 Domain-0
   14 S    0    5  75K 2868  0.1 12.0   1:44.04 f764pv
    3 S              0    0  0.1 12.0   2:28.45 gentoo32fv
    1 S              0    0  0.1  6.0   1:36.01 debian32fv
    -                                           (freebsd32fv)
Notice that some of the fields under the columns RDRQ, WRRQ, RXBY, TXBY are empty.
Why is this? It depends on what is supported by libvirt and Xen (or other hypervisor).
But first a general comment: If a field is left blank it means there
was some problem collecting the data. A blank field could mean that
libvirt doesn't support it, or that the hypervisor doesn't collect it,
or that there was some error collecting it. (To find out exactly why,
use the --debug filename command line
option). A zero (0) in a field means no traffic!
Collecting disk and network stats relies on two libvirt
functions called
virDomainBlockStats
and virDomainInterfaceStats, and these functions
simply did not exist
in libvirt before 0.3.2. So to get any disk
or network stats at all you will need to upgrade to
libvirt ≥ 0.3.2.
Even with a recent version of libvirt, what can be collected depends upon at least these factors:
At the time of writing (Sept 2007):
All of the above should be fixed over time in libvirt / Xen / QEMU.
It's a common request to see the actual memory and disk space in use by a guest. That is to say, not just the memory or disk block allocated to the guest, but how much the guest is really using.
Virt-top and libvirt do not support this, for the reasons given below. Instead you have to run some sort of agent inside the guest to get at these statistics. We suggest looking at collectd or nagios, but there are many other monitoring solutions around.
In Xen-like virtualization environments, a guest is allocated a fixed
block of RAM -- eg. 256 MB. Only the guest's kernel knows how much of
that memory is actually in use by processes. When you run
plain top inside the guest, it talks to the guest's
kernel to find out this information.
While in theory Xen could "spy" on the guest's kernel memory to get this information, it would be a very difficult thing to do reliably. The guest might not be in a consistent state, it might not be running Linux (or any recognised operating system).
The state of a guest's disks is some combination of what is actually in the guest's disk image and what is in the guest's kernel (think: unwritten dirty buffers in the guest's memory).
Because it's so useful to be able to monitor free disk space from the
dom0, in tests I found that you can usually find free and used disk
space by examining the disk image.
I proposed
an upstream patch to make this possible through libvirt, but it
was rejected. There is experimental code to do this in a program
called virt-df in the ocaml-libvirt / virt-top source.
Simple %CPU usage for a domain is calculated by sampling
virDomainGetInfo periodically and looking at the
virDomainInfo
cpuTime field. This 64 bit field counts nanoseconds of CPU time used
by the domain since the domain booted.
Let t be the number of seconds between samples. (Make
sure that t is measured as accurately as possible, using
something like gettimeofday(2) to measure the real
sampling interval).
Let cpu_time_diff be the change in cpuTime
over this time, which is the number of nanoseconds of CPU time used by
the domain, ie:
cpu_time_diff = cpuTimenow — cpuTimet seconds ago
Let nr_cores be the number of processors (cores) on the
system.
Use virNodeGetInfo
to get this.
Then, %CPU used by the domain is:
%CPU = 100 × cpu_time_diff / (t × nr_cores × 109)
Because sampling doesn't happen instantaneously, this can be
greater than 100%. This is particularly a problem where you have
many domains and you have to make a virDomainGetInfo
call for each one.
It is also possible to attribute load to individual physical CPUs. However this is very involved and you are better off examining the code to virt-top itself to see how this is done.
$Id: faq.html,v 1.6 2012/03/06 12:04:29 rjones Exp $