Audit Data Visualization
Over the past year, a lot of work has went into creating a native audit system for the Linux 2.6 kernel. It has the ability to collect lots of different kinds of information about the system in a fairly non-intrusive manner. It can intercept syscalls and record nearly anything about the syscall, watch files for access, collected events from MAC (Mandatory Access Control) mechanisms like SE Linux, as well as data from trusted apps that have been instrumented to send events.
The audit system shipped in RHEL-4 (Red Hat Enterprise Linux) is full featured. It can do all things mentioned above. The audit system shipped in Fedora Core 4 is not quite as full featured since it is lacking the file system watches capability. When the patch for this ability was sent upstream, it was noticed that there was an overlap between the patch and inotify. So the patch is being reworked. Hopefully, it will be in the mainstream linux kernel soon.
The audit system features 3 components, the daemon, auditctl (which is used to setup kernel parameters and rules), and the retrieval utilities. This article will focus on the data retrieval area of the audit system with specific detail about how to visualize the results. There are two programs, ausearch and aureport, that provide retrieval capabilities. Ausearch is kind of like a grep program in that it can be given certain parameters and it will display any records that match.
The aureport program was designed to aid in doing reports via awk, perl, or grep. It can select diffent kinds of information in the audit logs and present them in either columnar form or rankings. Some of the information it can select includes: logins, users, terminals, host names, executables, file access, avc objects, syscalls, watches, or event types.
You can optionally give it a success or failed flag to get just those kind of events. There is also another flag of interest and that is the -i flag which tells it to interpret the information from numeric to human readable. This means login uid 0 is changed to root. Another parameter that is important is -ts and -te for time start and time end respectively. These can help select information for a specific time range.
There are two types of visualization that we will cover in this article, flow graphs and bar charts. Flow graphs are used to show relationships. For example, we may want to see what syscalls are made by a program, what domains users are logging in from, or what account programs are being run from. It turns out that its really simple to create graphs if you have graphviz installed. Graphviz basically takes 2 columns of data separated by -> to show the direction that an arrow should be drawn and creates a graph.
I created a program, mkgraph, that will take two columns of data and create the graph for you. Download here. There is a variable inside it, EXT, which selects the file extension or format for output. It defaults to ps or postscript, but can be changed to png if you want.
Basically, any of the reports can be used. Its just a matter of working out the relationship that you want to show. For example, lets look at the user report:
[root@discovery ~]# aureport -u -i | more
User ID Report
====================================
# date time auid term host exe event
====================================
1. 09/26/05 15:33:18 unset ? ? /usr/sbin/postalias 547
2. 09/26/05 15:33:18 unset ? ? /usr/sbin/postalias 548
3. 09/26/05 15:33:18 unset ? ? /usr/sbin/postalias 549
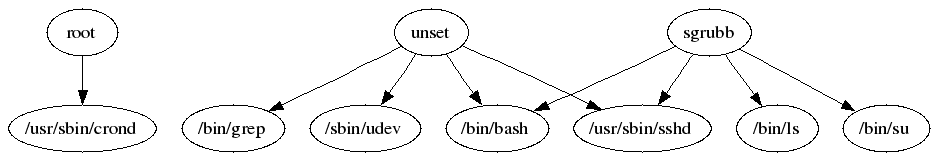
We could create graph that maps user to executable by extracting columns 4 and 7. Some locales will insert AM/PM after time, so you may need to adjust the column numbers by one. All lines of real data start with a number, so we could make a command that looks like this:
aureport -u -i | awk '/^[0-9]/ { printf "%s %s\n", $4, $7 }' | sort | uniq | ./mkgraph
In the following diagrams, I have limited the information used to generate these images for clarity. Png files viewed by a browser loses resolution. On your desktop, you can see more complicated postscript images clearly. You may have to massage the data depending on how much data you collected. In any event...to view the graph, you can use this: kghostview gr.ps.gz.
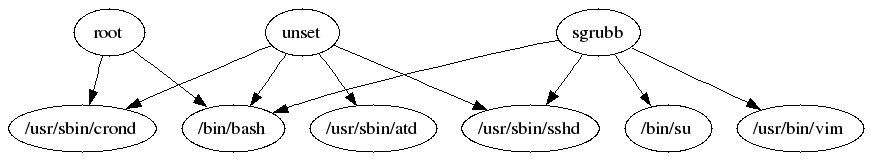
Here is an edited sample to give you an idea of what this looks like:
Some other commands:
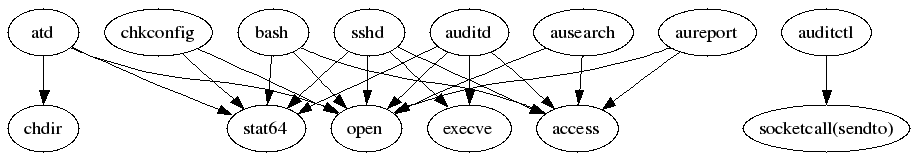
See what syscalls a program makes:
aureport -s -i | awk '/^[0-9]/ { printf "%s %s\n", $6, $4 }' | sort | uniq | ./mkgraph
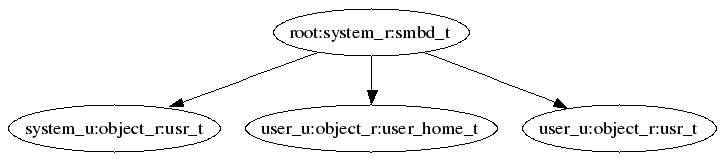
See avc denied subject to object map:
aureport -a --failed -i | awk '/^[0-9]/ { printf "%s %s\n", $5, $8 }' | sort | uniq | ./mkgraph
See who is accessing files:
aureport -f -i | awk '/^[0-9]/ { printf "%s %s\n", $8, $4 }' | sort | uniq | ./mkgraph
See what account is running which exes:
aureport -u -i | awk '/^[0-9]/ { printf "%s %s\n", $4, $7 }' | sort | uniq | ./mkgraph
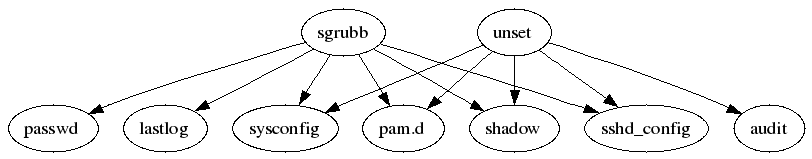
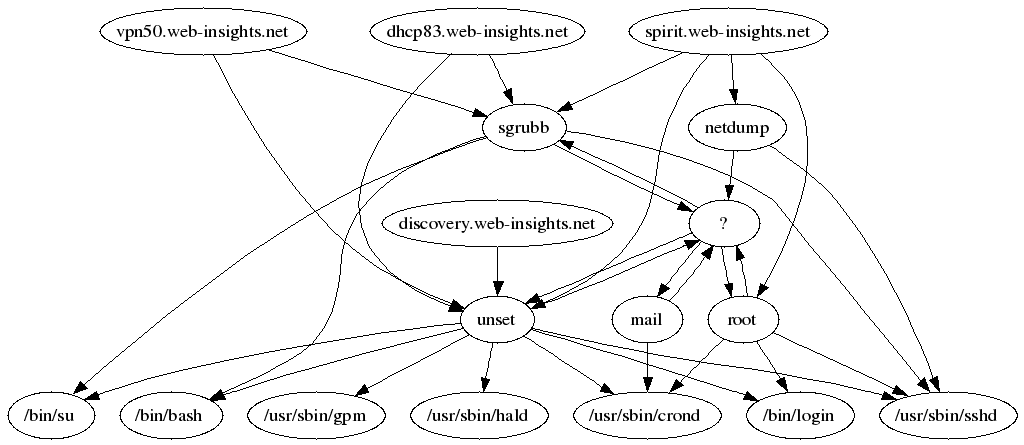
You can also combine graphs as long as they have a smooth transition. For example, we could graph: host -> user -> exes. This entails running the host report and extracting columns 4 & 6 to get the host to user mapping; and then running the user report and extracting columns 4 & 7 to get the user to exe mapping. This is done as follows:
aureport -h -i | awk '/^[0-9]/ { printf "%s %s\n", $4, $6 }' | sort | uniq > tmp.rpt
aureport -u -i | awk '/^[0-9]/ { printf "%s %s\n", $4, $7 }' | sort | uniq >> tmp.rpt
cat tmp.rpt | ./mkgraph
This is the graph it produces:
Ok, suppose you wanted to see bar charts of statistics. Aureport can help out here as well. If you add the --summary report, it will produce two columns of information. The first is the name of the object of the report and the second is the number of times it was encountered. For example, suppose wanted to see the failed accesses:
aureport -f -i --summary --failed | more
Failed File Summary Report
===========================
total file
===========================
15558 sysconfig
6614 /etc/sysconfig/hotplug
3740 /etc/sysconfig/i18n
2922 /etc/sysconfig/init
518 /etc/sysconfig/network
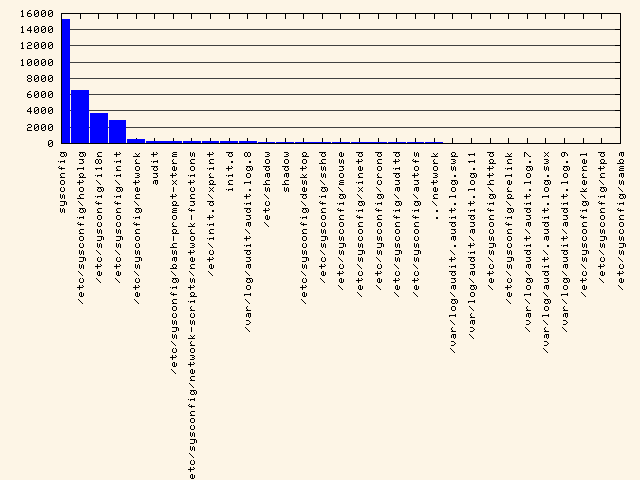
As you can see, the report is in a form that is almost usable. We can feed this information to gnuplot for rendering. The trick is that one column is text and gnuplot likes to plot numbers. What we will do is create a set of labels starting from 1 and substitute that label's number into the file that gnuplot processes. I have made a helper program that does this for us. It can be downloaded here. Let's try it out:
aureport -f -i --summary --failed | mkbar failed-access
This is the chart that it produces:
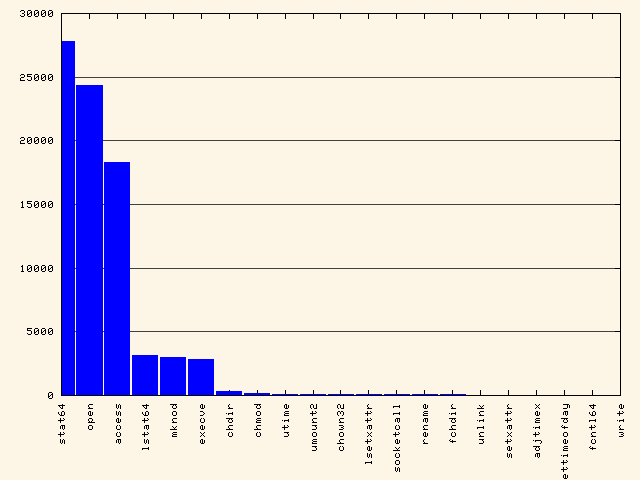
To see syscall rankings:
aureport -s -i --summary | ./mkbar syscall
To see event type rankings:
aureport -e -i --summary | ./mkbar events
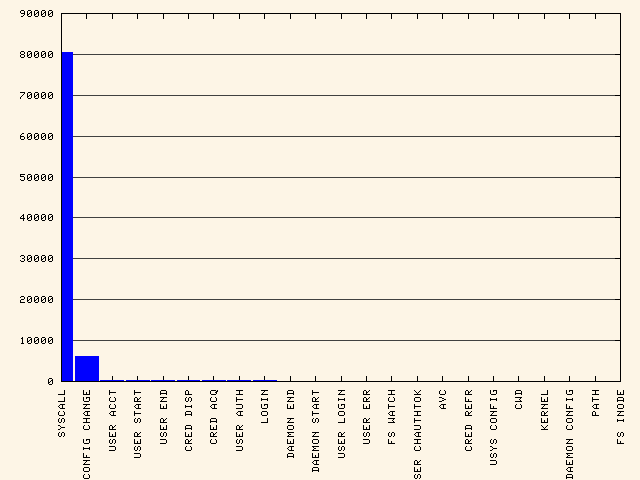
As you can see, SYSCALL is overwhelming the smaller ones. Let's remove it. To see all event types except syscall & config change:
aureport -e -i --summary | egrep -vi '(syscall|change)' | ./mkbar events2
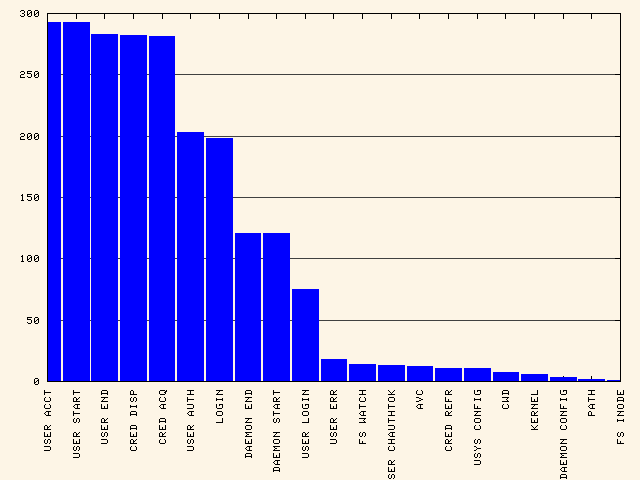
This wraps up the quick demo of how to create simple visualizations of audit information. As you can see, with a little effort you can create interesting charts and graphs from the audit logs. Hopefully, this quick tour will inspire others to create system reports that includes graphics.