It has become very popular to sound off about the "ridculous" memory usage of Firefox / Mozilla based browsers. Sadly most blog postings are along the lines of "I was browsing all day and got a firefox process taking up 500 MB!" - ie they contain little-to-no useful information to help solve the problem, or even diagnose whether there is a problem at all. For example, if you have 100 pages open (easily possible when using tabs) each containing 1 MB worth of images, that's 100 MB usage already. Add on usage for mmap'd ELF libraries, and locale data (50 MB on my system), tere might be nothing unusal at all with the browser "taking" 500 MB of memory. Of course much of this memory might be shared across apps too.
So to try and enable us to extract more useful information about application memory usage we've been experimenting with some testing & debugging tools.
Dogtail is a GUI test tool and automation framework written in Python. It lets us write very simple test scripts to drive Epiphany - opening web pages, creating tabs, opening windows, going back and forward in the history, etc. The value of Dogtail here is obvious - it lets us put together a 100% repeatable & reliable test suite - without such a test suite, its impossible to collect any useful data.
Most people use top or ps to look at how much memory an application
is using. This is a pretty much useless metric, since it does not give a break down of memory
between different types of objects - heap, stack, ELF libraries, mapped fonts & themes,
and locale data, nor does it show what objects are application private, vs shared. Fortunately
the files in /proc do provide at least a break down of what type of objects are mapped. Thus
we wrote a tool - "mem-monitor" - to process the files in /proc and provide a more granular
report of memory usage.
Runing it against my live Galeon browser instance, it reports:
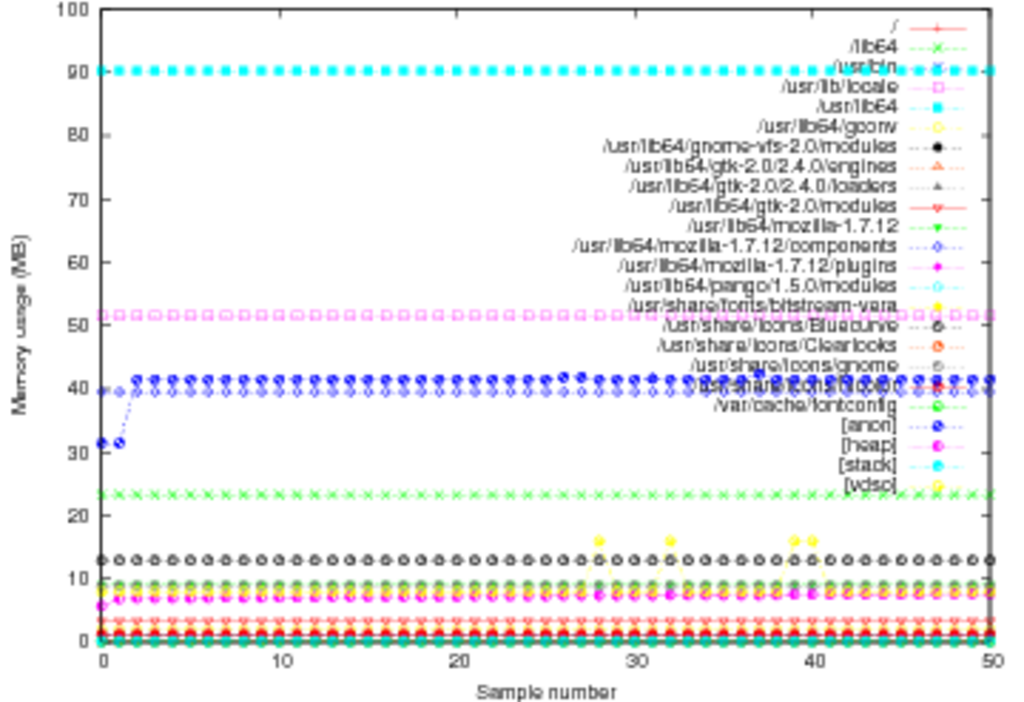
$ mem-monitor --gsort rsize `pgrep galeon`

Stats for PID 3979 at time 2006-03-14 20:29:02 GMT

Summary:

  Mapped:   450.72 MB
  Free:     17190690563.50 GB
  Virtual:  442.72 MB
  Resident: 104.14 MB
  Shared:   23.29 MB
  Text:     1364.00 kb
  Library:  0 bytes
  Data:     135.06 MB
  Unmapped: 338.58 MB

Groupings:

  /usr/lib64                                                  : 88.49 MB
  [heap]                                                      : 73.12 MB
  [anon]                                                      : 61.82 MB
  /usr/lib/locale                                             : 51.56 MB
  /usr/lib64/mozilla-1.7.12/components                        : 46.60 MB
  /usr/share/icons/Bluecurve                                  : 38.85 MB
  /usr/share/icons/gnome                                      : 26.54 MB
  /lib64                                                      : 23.26 MB
  /usr/lib64/mozilla-1.7.12                                   : 9.15 MB
  [vdso]                                                      : 8.00 MB
  /usr/lib64/gtk-2.0/2.4.0/loaders                            : 4.09 MB
  /usr/lib64/gtk-2.0/modules                                  : 3.41 MB
  /usr/lib64/gnome-vfs-2.0/modules                            : 2.17 MB
  /usr/lib64/gconv                                            : 2.05 MB
  /usr/lib64/libglade/2.0                                     : 2.04 MB
  /usr/bin                                                    : 1416.00 kb
  /usr/share/icons/hicolor                                    : 1256.00 kb
  /usr/lib64/gtk-2.0/2.4.0/filesystems                        : 1104.00 kb
  /usr/lib64/gtk-2.0/2.4.0/engines                            : 1092.00 kb
  /usr/lib64/mozilla-1.7.12/plugins                           : 1048.00 kb
  /usr/share/fonts/bitmap-fonts                               : 1044.00 kb
  /usr/lib64/pango/1.5.0/modules                              : 1036.00 kb
  /                                                           : 768.00 kb
  /usr/share/fonts/default/Type1                              : 344.00 kb
  /usr/share/fonts/bitstream-vera                             : 312.00 kb
  /var/cache/fontconfig                                       : 144.00 kb
  [stack]                                                     : 124.00 kb
  /usr/share/icons/Clearlooks                                 : 112.00 kb
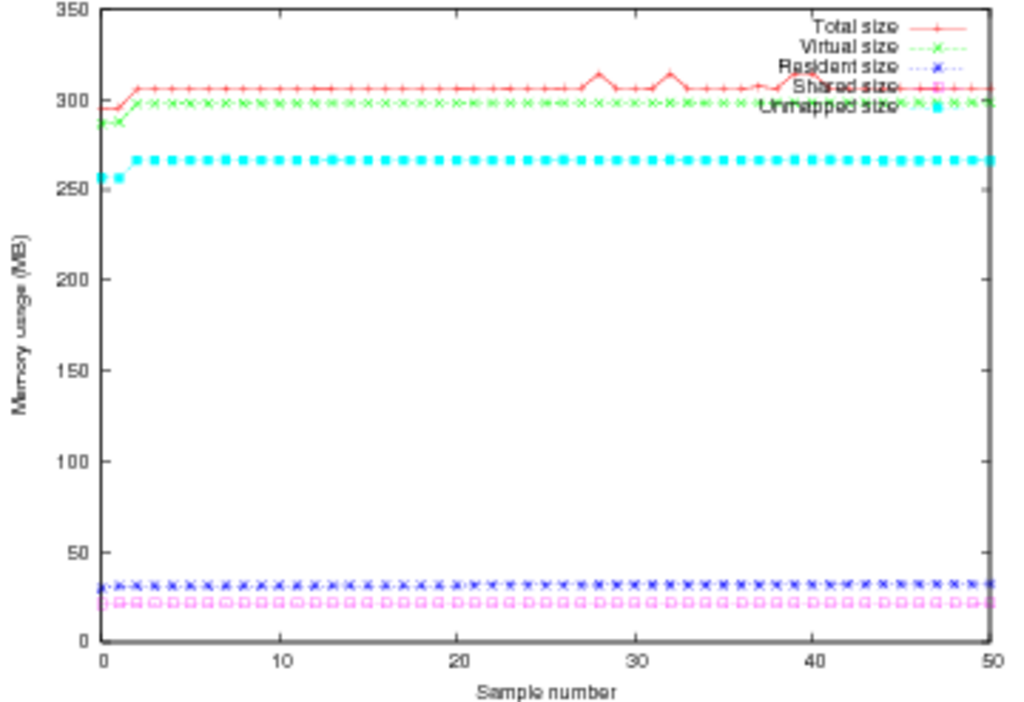
So what can be learn from this report. First, there are 100 MB of shared libraries loaded from /usr/lib64 and /lib - much of this is shared across all apps with the same library loaded. The heap and anonymous maps are application private data, totalling 130 MB - we should keep an eye on this during test runs. The 51 MB locale files are shared across all apps, as are the 64 MB of icons. The mozilla components are quite significant at 46 MB in size too.
So in summary, out of the headline 450 MB memory usage, the interesting regions which are purely runtime data are the heap / anon pages at 150 MB. The rest of the 300 MB is ELF libraries and static data. Unfortuntely we can't validate that this static data truely is shared across all apps, but it is certainly not going to be growing over the course of a browsing session, so we can ignore it for now (perhaps applying SystemTAP to probe the kernel for info at a later date).
One complication with X11 apps is that the server may well hold resources on behalf of
the application, in particular pixmaps which consume surprising amounts of memory. The
xrestop program shows a summary, for example
xrestop - Display: localhost:0
          Monitoring 59 clients. XErrors: 0
          Pixmaps:   84069K total, Other:     374K total, All:   84444K total

res-base Wins  GCs Fnts Pxms Misc   Pxm mem  Other   Total   PID Identifier
4600000   749   61    1  485  332    62064K     27K  62091K   ?
But doesn't let you know just what those 485 pixmaps contain. To deal with this problem we created a LD_PRELOAD hack which overrides the XCreatePixmap and XFreePixmap calls, logging their arguments & stack traces to a file. A little more magic with libtiff, and all the pixmaps are saved to TIFF image files for offline viewing. The log file is then post-processed to generate some reports:
Now the supporting pieces are all ready, the test suite can be formed. The basic strategy is:
In the actual implementation a number of different variants on the last step were created:
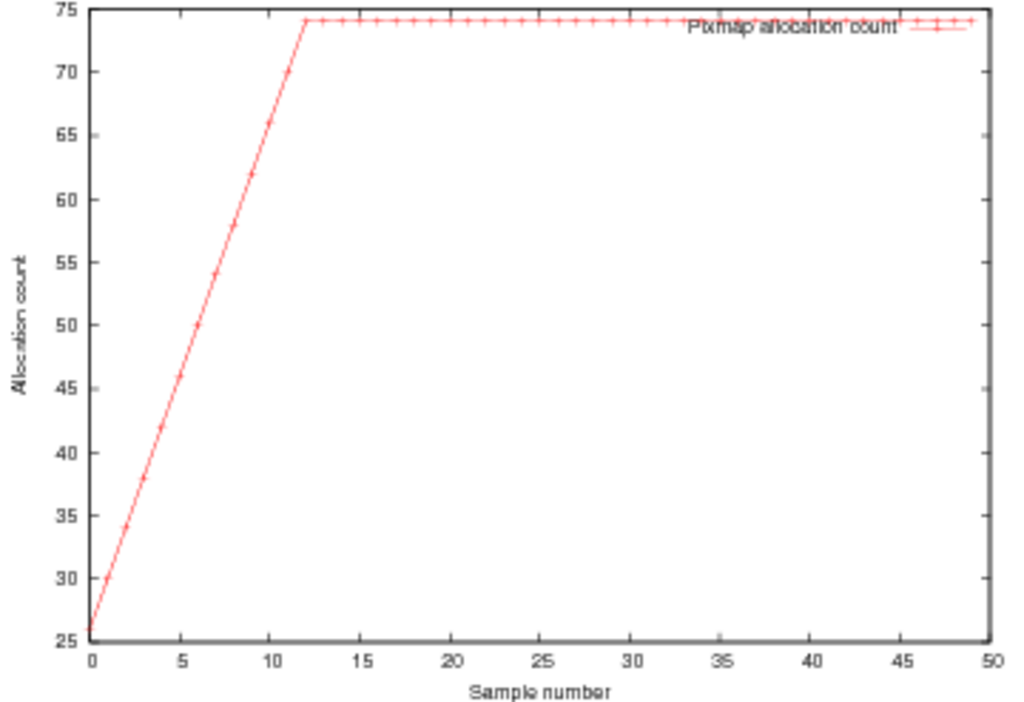
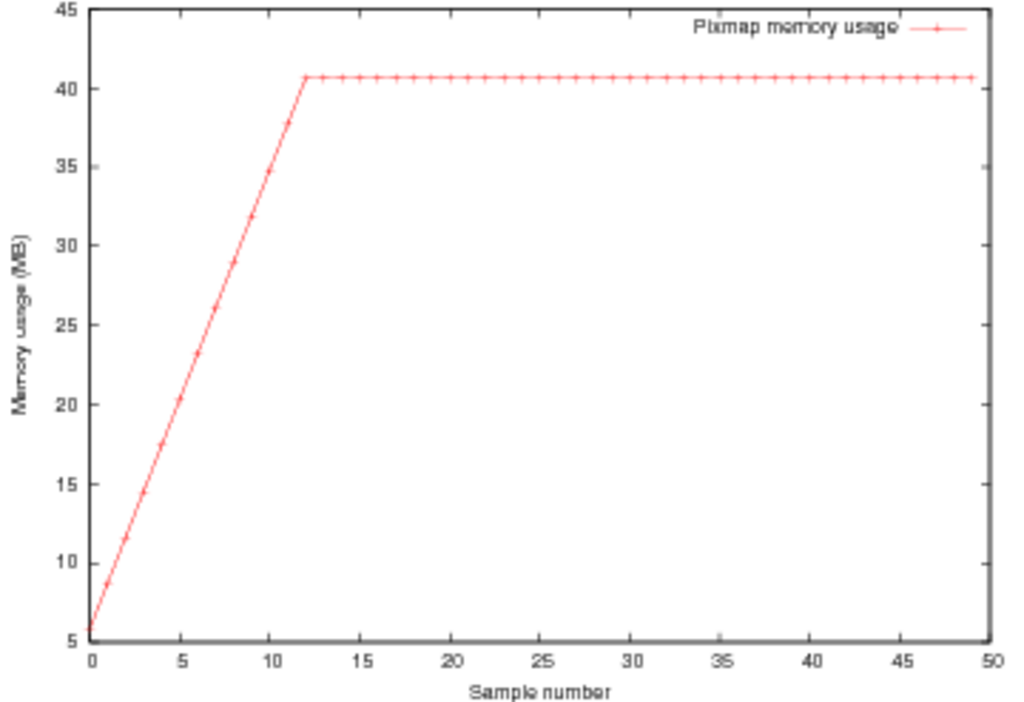
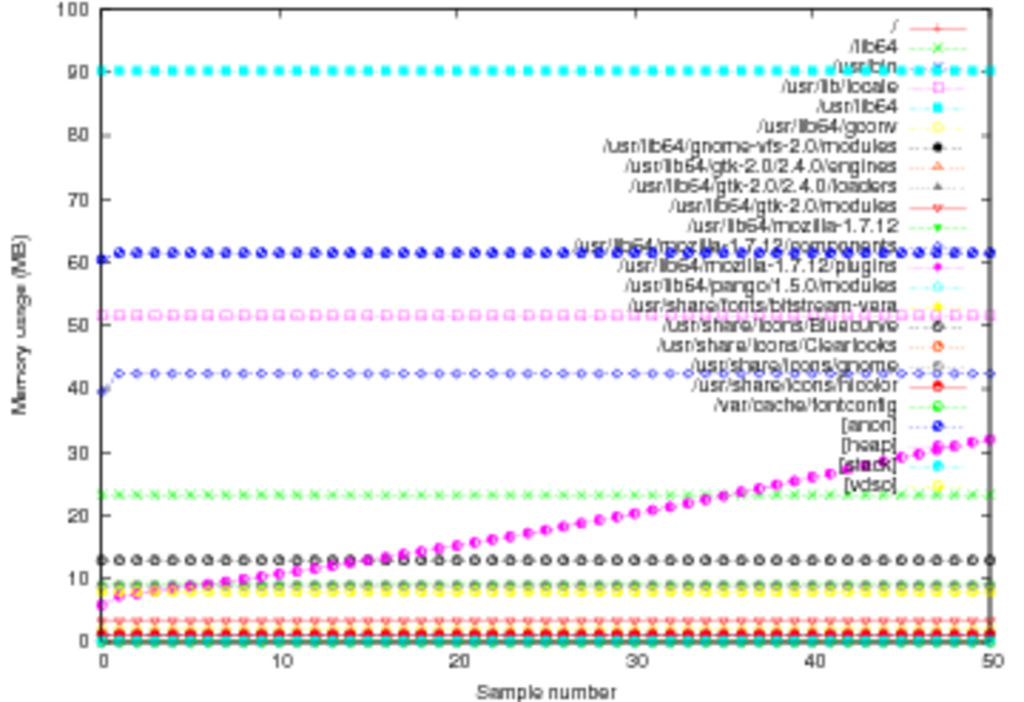
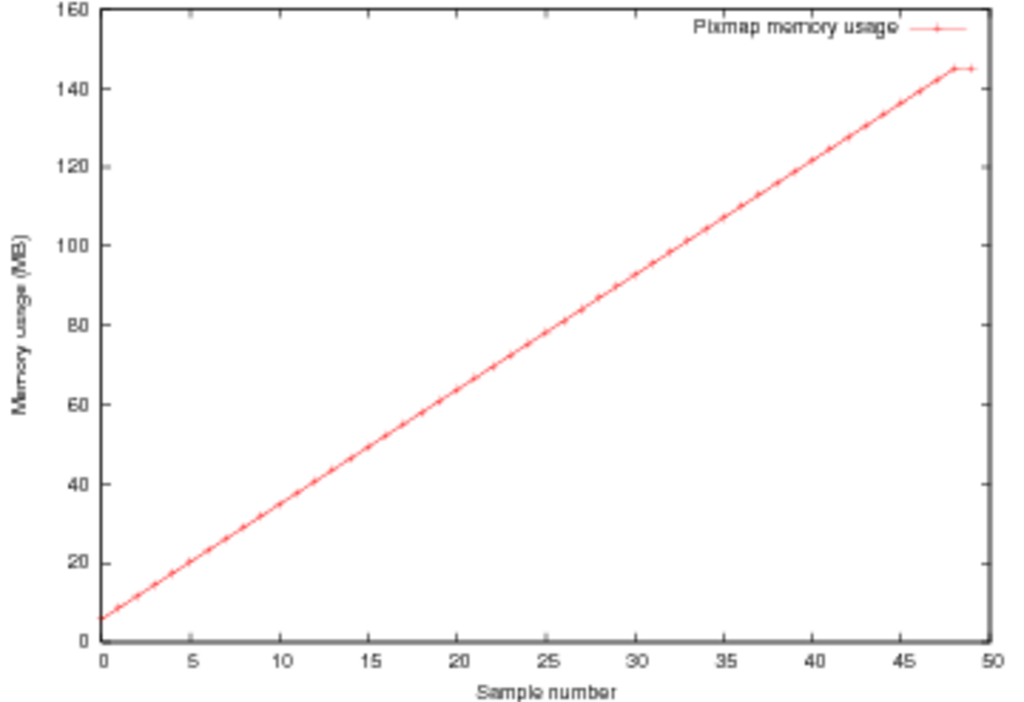
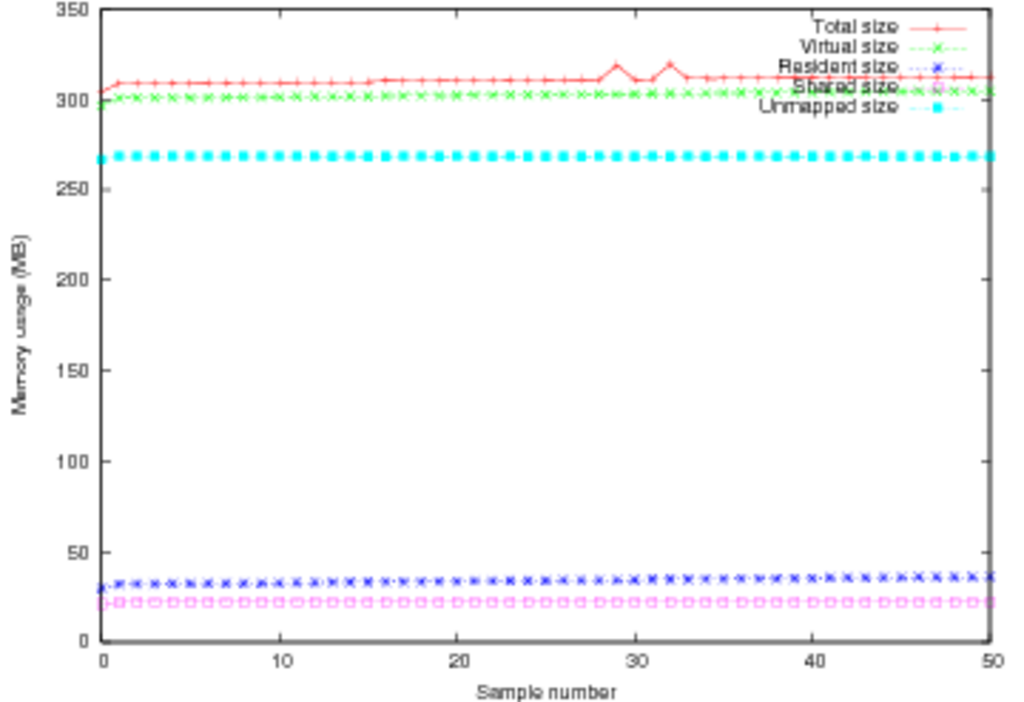
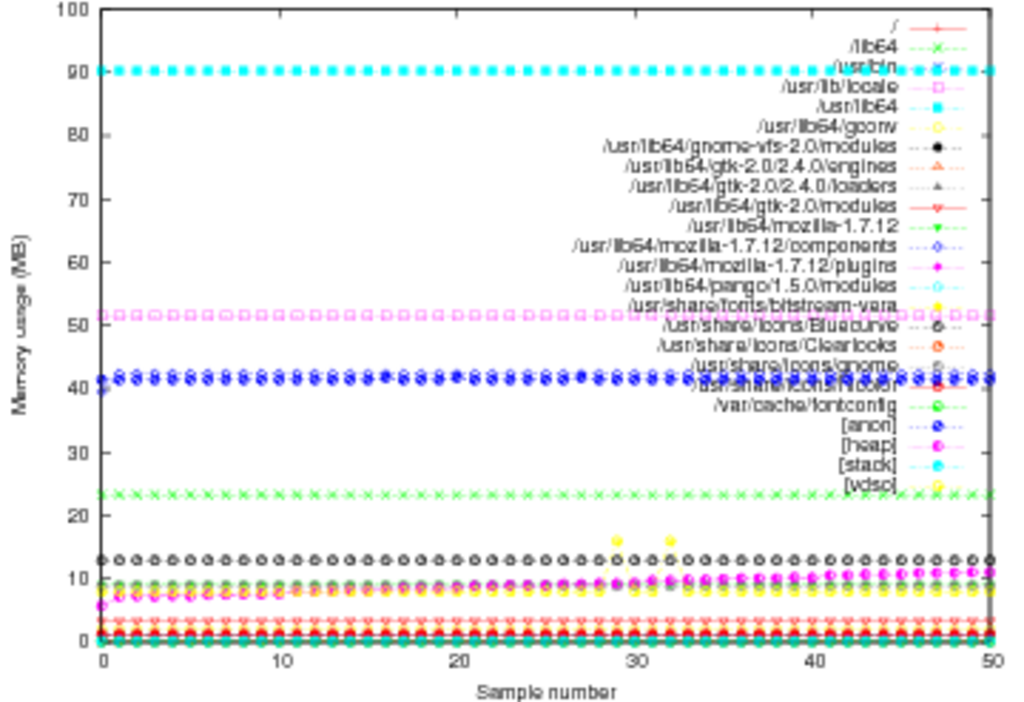
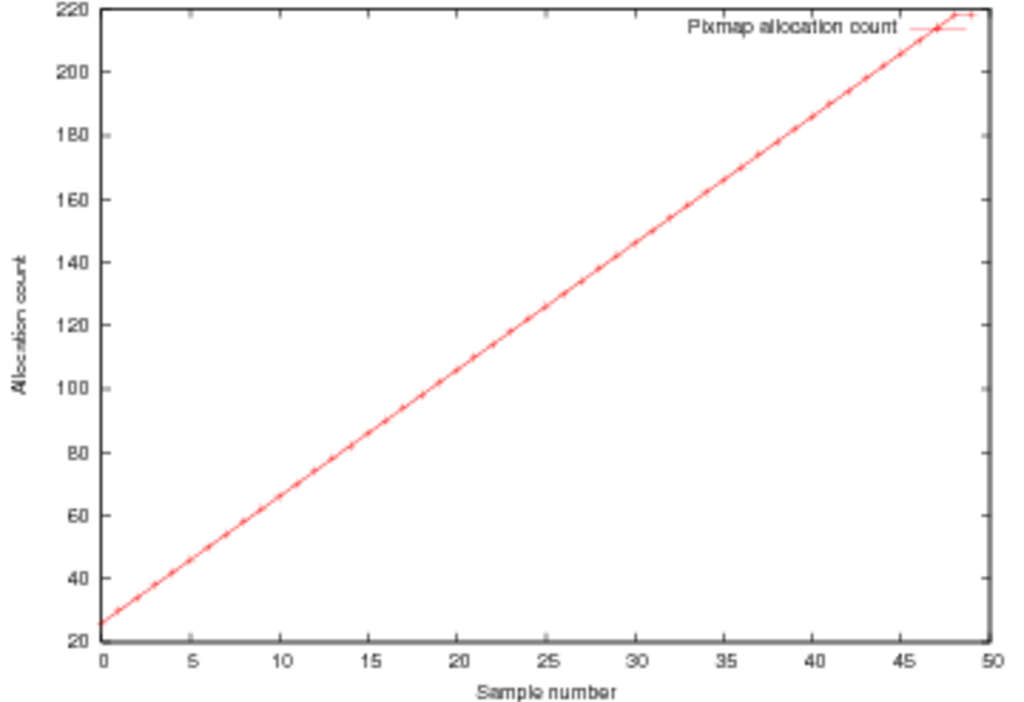
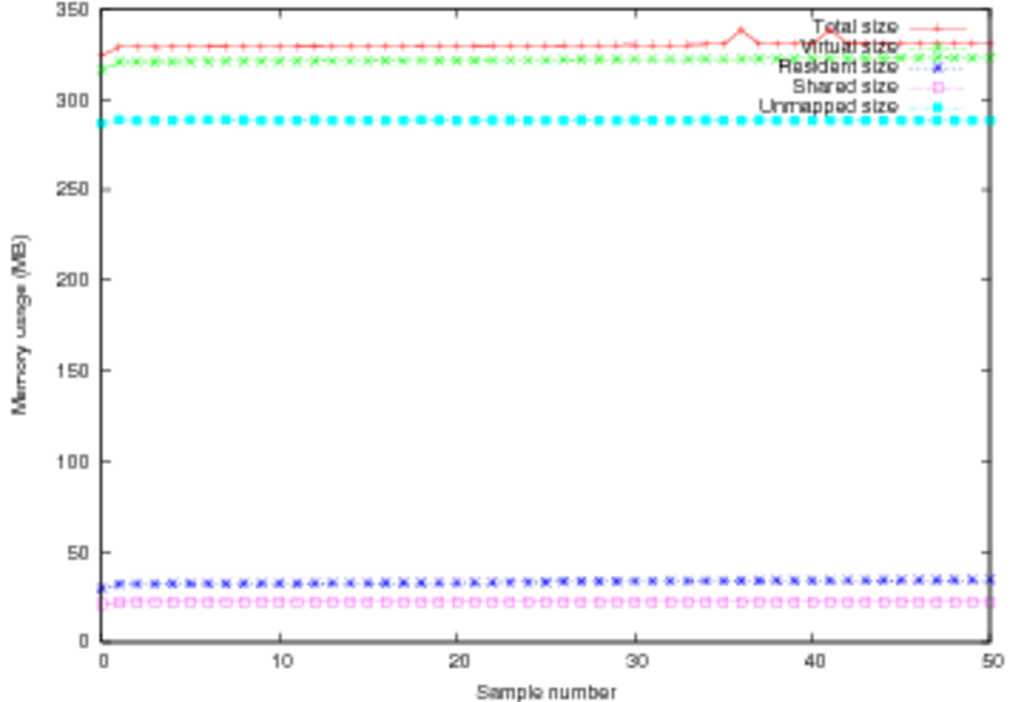
Running these tests revealed some interesting & unexpected results. The first test starting releasing pixmaps on the X server when total memory usage hit about 74 MB, with 12 pages loaded into history. The remaining tests *never* freed any pixmaps even after 50 pages / 220 MB of pixmaps are loaded. The stack traces associted with the XFreePixmap calls show some form of reference counting garbage collection is taking place to release pixmaps. The graphs would later tests suggest that this reference counting is broken when multiple tabs are open. On the plus side, the client side memory usage appears to be sane, with the only significant increase in usage being demonstrated when opening a new tab for every single web page loaded.
| Test | Pixmap count | Pixmap memory | Process memory | Mapped object memory |
|---|---|---|---|---|
| test1.py | pmaps-count.png | pmaps-size.png | mem-17761-summary.png | mem-17761-grouping.png |
| test2.py | pmaps-count.png | pmaps-size.png | mem-20933-summary.png | mem-20933-grouping.png |
| test3.py | pmaps-count.png | pmaps-size.png | mem-25338-summary.png | mem-25338-grouping.png |
| test4.py | pmaps-count.png | pmaps-size.png | mem-1098-summary.png | mem-1098-grouping.png |
BTW, apologies for the poor quality PNG images.
Last updated on Monday, Feb 6, 2006